Adobe has a nice real-time dashboard built directly into Reports & Analytics (SiteCatalyst). It is easy to configure and get up and running quickly. According to Adobe product manager Ben Gaines “Real-Time reports in Adobe Analytics has become one of the most popular features in Reports & Analytics.” What you may not know is that real-time data can be accessed via Adobe’s reporting API. Adobe has a great tutorial on how to get started with the Adobe Analytics Real-Time API that you need to check out. The example was used in a lab session at past Adobe Summits and it looks like it was offered again at the 2016 Adobe Summit. If you went to Summit let me know how the session was. I haven’t attended the session before, but I was in search of a real-time API sample for Adobe Analytics and I stumbled upon this gem.
In this post I am going to walk you through Lesson 1 and Lesson 6 from this tutorial. Lesson 1 gives you the basic fundamentals needed to run a Adobe Analytics real-time report. Lesson 6 gives you a working real-time dashboard with snazzy D3.js visualizations that you can load right now in your browser. Hopefully you can use this as the foundation for building some actionable solutions that leverage real-time data at your organization. I look forward to hearing about the real-time dashboard you build or the real-time content and campaign optimization or the real-time site health alert tools. Please share what you create in the comments or @ryanpraski.
Lesson 1
Start by downloading the analytics realtime dashboard example from GitHub. Find this in your downloads and unzip it. I unzipped the folder on my desktop for this example.
View Real-Time Reports in Adobe Analytics Reports & Analytics
1) Find the Lesson 1 folder on your computer. The path to the folder on my computer is: C:\Users\ryanpraski\Desktop\analytics-realtime-dashboard-example-master\lessons\lesson_1
2) Open the README file in the lesson_1 folder in your text editor or on GitHub.
3) You will have to use your own Adobe Analytics login and password and not the lab password listed in lesson 1.
4) Login to Adobe Analytics and in Reports & Analytics click View All Reports > Site Metrics > Real-Time. You can switch between the 3 real-time reports that have been previously setup by an Admin at your company by clicking on the links next to “Reports:” just below the top nav.
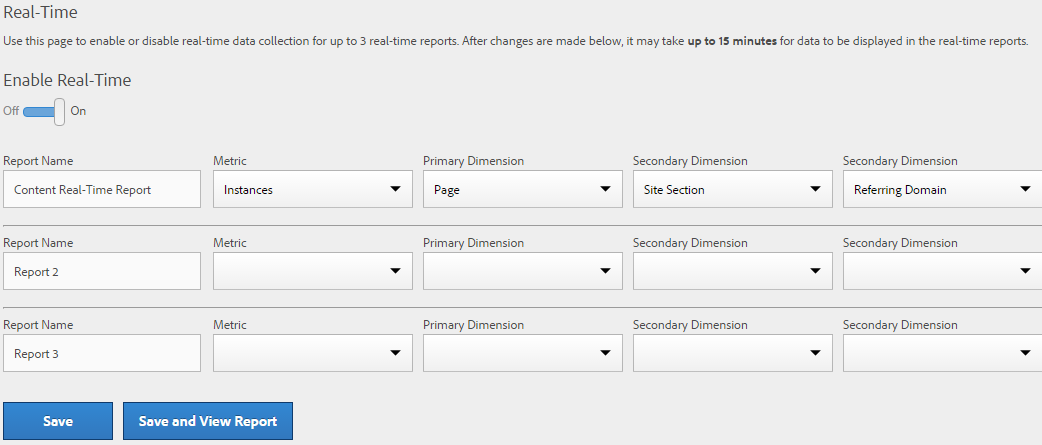
5) If the report suite selected does not have a real-time report configured you will see this message: “Report Suite Not Yet Configured. This report suite has not yet been configured for Real-Time reporting. Click here to setup this report suite for Real-Time.” If you are an Admin you will be able to click the link to setup Real-Time. Make sure “Enable Real-Time” is set to On. Then give your real-time report a name and select a metric, primary dimension and two secondary dimensions. For the example I selected Instances as my metric, Page as my primary dimension and Site Section and Referring Domain as my secondary dimensions. Click Save and View Report and you should start to see real-time data.
Pull a Real-Time Report with the Adobe Analytics Reporting API
1) You will have to use your own Adobe Analytics API credentials not the lab credentials listed in lesson 1. If you are an admin go to User Management and select your login and click on edit. Make sure you are part of the Web Services Access Group and retrieve your Web Services User Name and Shared Secret from the green box in the access section. If you don’t have admin access request this info from someone who does have access.
Web Services Credentials
User Name: username:company name
Shared Secret: abcdefghijklmnopgrstuvwxyz
2) Go to the Adobe Analytics API Query Explorer and enter your API User Name and Shared Secret. The API “Report” and Method “Run” should be selected. If they are not automatically selected then select them from the drop downs.
3) Copy the code below and paste it over the code that is pre-populated in the JSON query box. Make sure to change “rtd-example” to your actual report suite in the code. Then click the Get Response button. You should see the results of your query in the Response box at the bottom of page showing page views every 5 minutes for the last hour.
{
    "reportDescription":{
        "source": "realtime",
        "reportSuiteID":"rtd-example",
        "metrics":[
            {"id":"pageviews"}
        ]
    }
}
4) There are several other more detailed sample queries in the Lesson 1 documentation that you can work through. Just make sure to swap out the “rtd-example” report suite with your own report suite before you run the queries. There is additional documentation from Adobe here that shows sample queries and includes the different parameters you can use in a real-time report request.
5) Here is a more detailed sample real-time query: Top 100 product revenue every 2 minutes for the last 2 hours where the product name contains skis or boots. Currently top 100 is the maximum for any real-time query. This code is for version 1.4 of the Adobe Analytics API.
{
    "reportDescription":{
        "source": "realtime",
        "reportSuiteID":"rtd-example",
        "metrics":[
            {"id":"pageviews"}
        ],
        "elements":[
            { "id": "page",
               "search": { "type": "OR", "keywords": ["skis", "boots"] },
               "top":100
            },
        ],
        "dateFrom":"-2 hours",
        "dateGranularity":"minute:2"
    }
}
6) Here is another example showing how to apply multiple filters to an Adobe Analytics real-time API query. In this case I want to alter the query from above slightly to include pages that contain skis or boots in the page name but do not contain salomon or atomic (this are brands of skis and boots). This code is for version 1.4 of the Adobe Analytics API.
{
    "reportDescription":{
        "source": "realtime",
        "reportSuiteID":"rtd-example",
        "metrics":[
            {"id":"pageviews"}
        ],
        "elements": [
      {
        "id": "page",
        "search": {
          "type": "AND",
          "searches": [
            {
              "type": "OR",
              "keywords": [
                "skis",
                "boots"
              ]
            },
            {
              "type": "NOT",
              "keywords": [
                "salomon",
                "atomic"
              ]
            }
          ]
        }
      }
    ]
  }
}
Now let’s skip to Lesson 6 where everything from Lessons 1-5 comes together into a web based real-time dashboard that automatically updates. The dashboard uses jQuery, and D3.js for some slick data visualization.
Lesson 6
Create a Snazzy Real-Time Adobe Analytics Dashboard Now
1) Since we skipped Lesson 2-5 you’ll have to update the config.js file in the analytics-realtime-dashboard-example-master that you downloaded. The path to the file on my computer is: C:\Users\ryanpraski\Desktop\analytics-realtime-dashboard-example-master\js\config.js
Below is a sample config.js file. Make sure to update it with your credentials and save it on your computer.
var config = {
   username:     "User Name:Company Name",
    secret:       "abcdefghijklmnopgrstuvwxyz",
    reportSuite:  "rsid",
    endpoint:     "api.omniture.com"
};
2) Find the Lesson 6 folder on your computer. The path to the folder on my computer is: C:\Users\ryanpraski\Desktop\analytics-realtime-dashboard-example-master\lessons\lesson_6
3) Open the README file in the lesson_6 folder in your text editor or on GitHub.
4) Open the lesson_6.html file in your web browser and then open it a second time in a text editor. The path to the folder on my computer is: C:\Users\ryanpraski\Desktop\analytics-realtime-dashboard-example-master\lessons\lesson_6\lesson_6.html
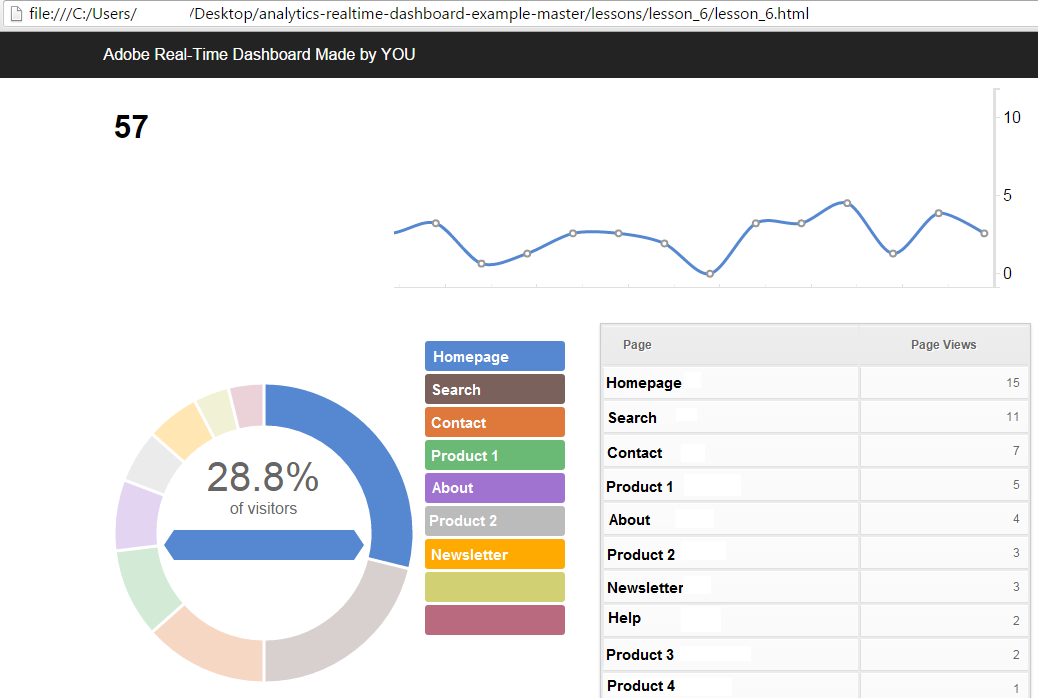
5) When you load the lesson_6.html file in your browser you should see an animated number flash on the screen of total page views for the past 15 minutes in the top left, a continuously updating trend line with page views by minute for the past 15 minutes, and a table with the top 10 pages by page views for the last 15 minutes.
6) Follow the instructions in the lesson_6 README file to add the donut chart to your dashboard. If you have trouble getting the the donut chart included on your lesson_6.html file, you can open a complete version of the dashboard with the Lesson 6 code updates already done for you. The path to this complete “final dashboard” file on my computer is: C:\Users\ryanpraski\Desktop\analytics-realtime-dashboard-example-master\index.html
7) Your real-time dashboard should look like the screen shot below and will dynamically update with real-time Adobe Analytics data from the reporting API.
8) If you’d like to create a different report that uses the same visualizations change the query parameters in the lesson_6.html or index.html file within the var params show in the code snippet below:
        var method ='Report.Run';
        //edit query here
        var params = {
            "reportDescription":{
                "source": "realtime",
                "reportSuiteID": config.reportSuite,
                "metrics": [
                    { "id": "pageviews" }
                ], "elements": [
                    { "id": "page" }
                ],
                "dateFrom": "-15 minutes",
                "dateGranularity": "minute:1"
            }
        };
Your Turn: Create Your Own Real-Time Dashboard or Real-Time Campaign Optimization Tool
I hope this tutorial opens your eyes to what is possible with real-time data and gives you a solid understanding of how to pull real-time data from the Adobe Analytics reporting API. Thanks to the Adobe Analytics team for sharing such a great tutorial with the world. Hopefully it inspires you to build your own dashboard or solution that leverages real-time data. Here are some ideas for solutions: real-time campaign optimization, real-time site health alerting, and real-time content optimization. If you are interested in other tutorials on how to get started with the Adobe Analytics API check these out:
How to Add 100 Users to Adobe Analytics in Seconds
Using the Adobe Analytics API for Report Suite Configuration
Also, check out @randyzwitch‘s Adobe Analytics API package for R called RSiteCatalyst.
Please share any comments, questions, or ideas for real-time solutions in the comments below or @ryanpraski.

