Adobe has a nice real-time dashboard built directly into Reports & Analytics (SiteCatalyst). It is easy to configure and get up and running quickly. According to Adobe product manager Ben Gaines “Real-Time reports in Adobe Analytics has become one of the most popular features in Reports & Analytics.” What you may not know is that real-time data can be accessed via Adobe’s reporting API. Adobe has a great tutorial on how to get started with the Adobe Analytics Real-Time API that you need to check out. The example was used in a lab session at past Adobe Summits and it looks like it was offered again at the 2016 Adobe Summit. If you went to Summit let me know how the session was. I haven’t attended the session before, but I was in search of a real-time API sample for Adobe Analytics and I stumbled upon this gem.
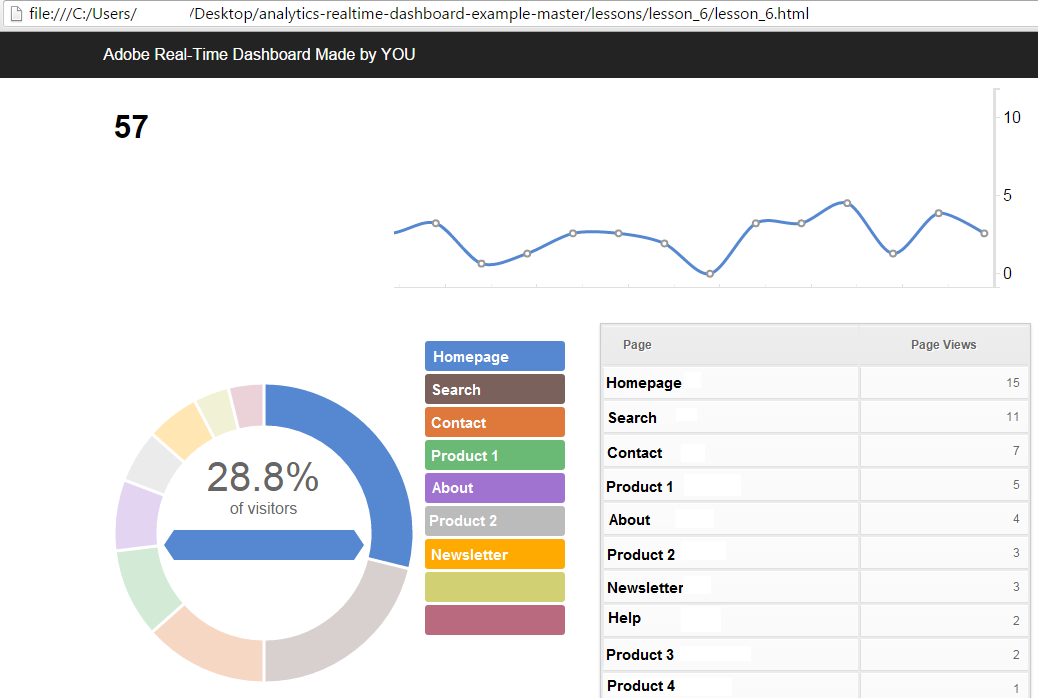
In this post I am going to walk you through Lesson 1 and Lesson 6 from this tutorial. Lesson 1 gives you the basic fundamentals needed to run a Adobe Analytics real-time report. Lesson 6 gives you a working real-time dashboard with snazzy D3.js visualizations that you can load right now in your browser. Hopefully you can use this as the foundation for building some actionable solutions that leverage real-time data at your organization. I look forward to hearing about the real-time dashboard you build or the real-time content and campaign optimization or the real-time site health alert tools. Please share what you create in the comments or @ryanpraski.

