This tutorial shows you how to create a real-time Google Analytics Data Studio dashboard. The real-time Google Analytics data is fed to Google Data Studio via a Google Sheet. The Google Sheet uses Google App Script to query the Google Analytics real-time API. The Google Data Studio dashboard is automatically updated using a Chrome browser extension.
How it Works Flow Chart
Google Analytics Real-Time API > Google App Script > Google Sheet > Google Data Studio Sheets Connector > Google Data Studio Dashboard > Refresh Automatically using Data Studio Auto Refresh Chrome Extension
Google Data Studio Dashboard
Let’s start with the end product the Real-Time Google Data Studio Google Analytics dashboard and work backwards. Below is the embedded data studio dashboard.
Google Sheet with Google App Script Pulls Real-Time Data
You will setup a Google Sheet to automatically query the Google Analytics real-time reporting API using the magic of Google App Scripts. Make a copy of my sample Google Sheet. This is the data source for you data studio dashboard. It includes the App Script. Go to File > Make a copy to save a copy of the Google Sheet with the Google App Script to your Google Drive.
Google App Script
The App Script shown below will be included when you copied and saved the Google Sheet to your Google Drive in the previous step. Go to format > script editor this will open the Google App Script editor. In the code go to line 44 and 91 and replace my Google Analytics View ID ga:94579701 with your view id. To find this id go to Google Analytics > Admin > and copy your view id and paste it into the App Script.
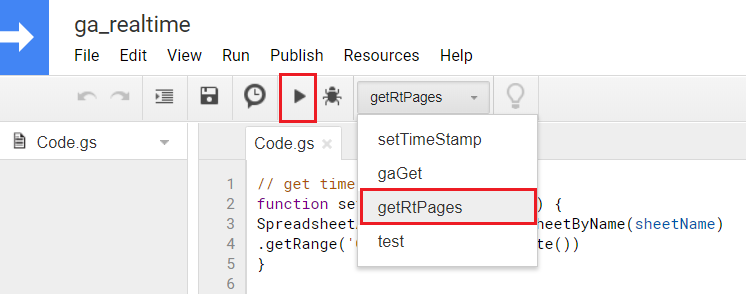
You’ll need to authorize the functions in the Google App Script. To do this choose the getRtPages function from the drop down below the header menu to the right of the debug (bug) icon. Then click on the play button to the left of the debug icon.
An authorization message will pop up that says: Authorization required ga_realtime needs your permission to access your data on Google. Click the Review Permissions button. Next you will see a Google sign in window. Make sure to sign in or select the Google account that has access to the Google Analytics account with the view id that you will be querying. You’ll see a message saying the ga_realtime app is not approved. Click on Advanced then click Go to ga_realtime (unsafe). This will launch an approval window to allow the ga_realtime app script to See, edit, create, and delete your spreadsheets in Google Drive and View your Google Analytics data. Click Allow. This only allows the App Script to do this for this specific Google Sheet.
Your App Script will finally run. On the first run of the App Script you’ll see the error message like the message shown below:
GoogleJsonResponseException: Project 1004671496245 is not found and cannot be used for API calls. If it is recently created…
Click on details to see the full error message. You’ll see that the developer console project needs to be created and the project needs to enable the Google Analytics API. Here is the link to my developer console project (yours should look similar). https://console.developers.google.com/apis/api/analytics.googleapis.com/overview?project=1004671496245 Then click Enable to enable the Analytics API. Then go back to the App Script and run the getRtPages function again. This time you run the App Script you should not see any errors. If you open your Google Sheet you should see the top real-time pages sorted by page views in the last 30 minutes.
Time Based App Script Trigger
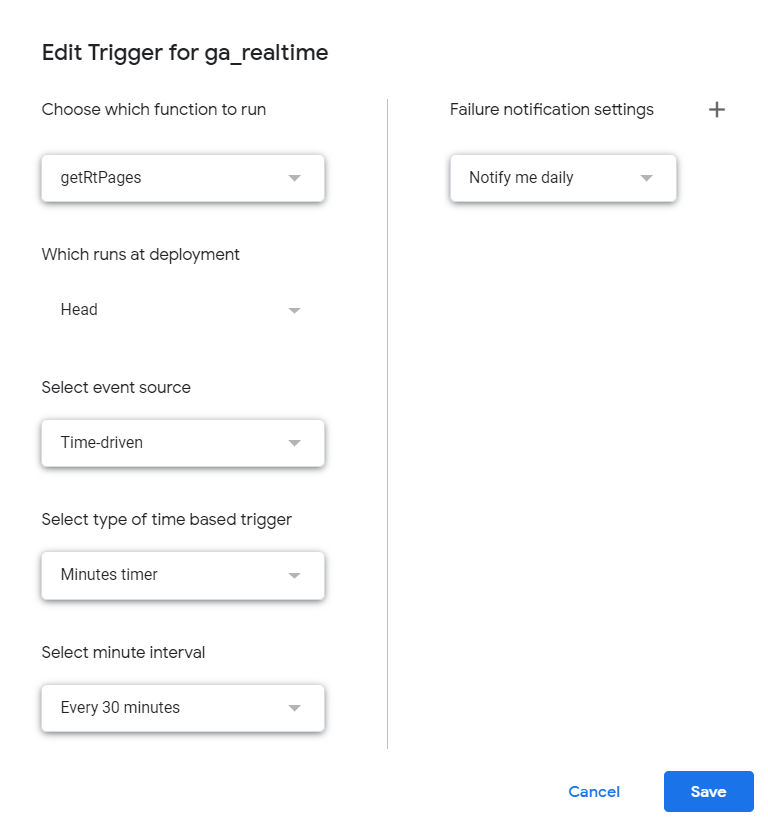
This trigger will automatically run the Google Analytics real-time query every 30 minutes so your data will be fresh in the Google Sheet for your Google Data Studio dashboard. To set up the time based trigger click on clock icon to the left of the play icon in the Google App Script Editor. For the trigger you’ll want to Choose the getRtPages function to run. Select a Time-driven event source and a Minutes Timer type of time based trigger. Select minute interval Every 30 Minutes. For the Failure notification settings I have it setup to Notify me daily. Click save to save your time based trigger. The screen shot below shows the setup for the trigger.
Copy the Google Data Studio Real-Time Dashboard
Make a copy of my sample Data Studio dashboard by clicking on the copy icon in the top right of the dashboard.
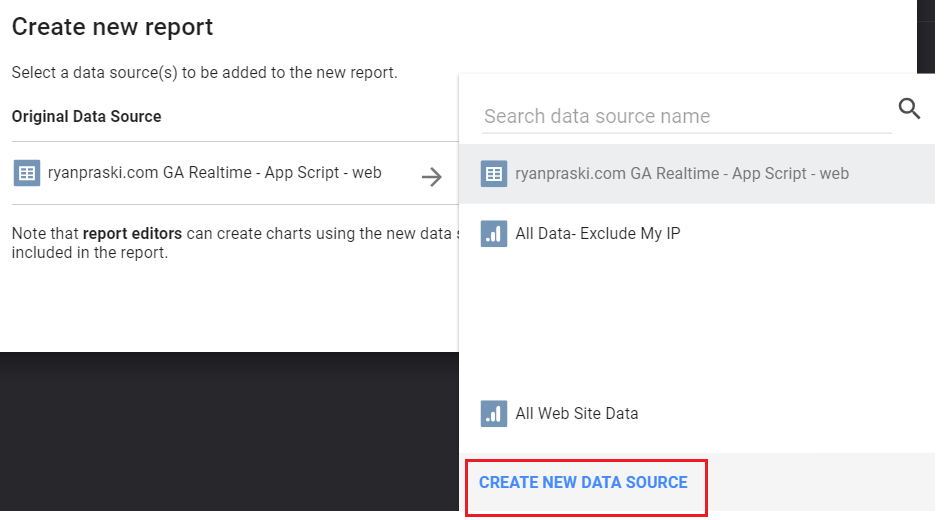
After copying the Data Studio dashboard the Create new report prompt shown below will popup. You’ll want to choose Create New Data Source in the right pane under the New Data Source. Then choose Google Sheets as the source. This will open a list of all your Google Sheets. The screen shot below shows the data studio report copy process. Choose the sheet that you copied from my sample sheet as your source. Then click Connect then click Add to Report then click on Create Report.
Download the Data Studio Automatic Update Chrome Extension
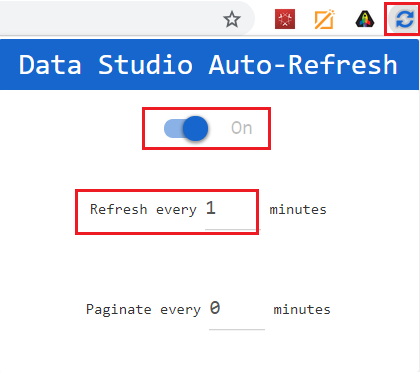
To automatically refresh your Google Data Studio dashboard to make the report truly real-time add the auto refresh Chrome browser extension. Once the extension is installed click on the blue circle icon to setup the extension while you have your data studio dashboard open. Turn the Data Studio Auto-Refresh extension to On then choose the Refresh every 1 minute. This will automatically refresh the dashboard every minute. This is useful if you are displaying the real-time Google Analytics Data Studio dashboard on a TV monitor in your office.
Next Steps: Make Your Real-Time Google Analytics Data Studio Dashboard Even Better
You can build on this basic example and make any real-time Google Analytics query you want. To see the dimensions and metrics that are included in the Google Analytics real-time report API check out the documentation here. You can also test your real-time queries using the Google Analytics real-time query explorer here. You can also change the formatting of the Data Studio dashboard to make it even more sleek and useful for your business.


