How to pull a Google Analytics report with more than 10,000 rows?
How to get around Google Analytics Sampling Limitations?
Sample Google Analytics Sheet used in this tutorial (file make a copy to edit)
How do you pull a Google Analytics report with more than 10,000 rows? How do you get around Google Analytics Sampling Limitations? These were the most common questions I was asked after my recent Google Analytics reporting API Python tutorial. This new tutorial will show you how to export more than 10,000 rows using the Google Analytics Spreadsheet Add-on and how avoid the sampling limitations of Google Analytics. I also have another post in the works on how to use Python and the Google Analytics API to avoid sampling and pull even more data. Keep an eye out for the new post!
Google Analytics 5,000 Row Export Limit
If you have been a long time user of Google Analytics, you remember way back when you could only export a maximum of 500 rows directly from the Google Analytics interface. You’ll remember back to before 2009 when the Google Analytics reporting API did not exist. Then Google increased the maximum interface based data export to 5000 rows. For crafty users, there was a hack that let you change the URL parameter for the row limit or tablerowCount to a number greater than 10,000 rows. You could export 10,000 or more rows (sometimes more than 40,000 or 50,000 rows before your browser hung up) to a CSV file just by changing the URL parameter. Then in 2014 Google stopped letting users hack the URL to change the row limit parameter and 5000 rows is currently the maximum export for all reports in the Google Analytics interface. Note that unsampled reports for Google Analytics Premium customers are available via the Google Analytics interface. For unsampled Google Analytics reports the maximum number of unique dimension values (i.e. rows) that will be reported is 3 million.
So what is a digital analyst to do if 5000 rows of data are not enough? Today you can use tools like Google Analytics Query Explorer and the Google Analytics Sheet Add-On to export 10,000 or more rows using the steps described in this post.
Export 10,000 or More Rows from the Google Analytics Query Explorer
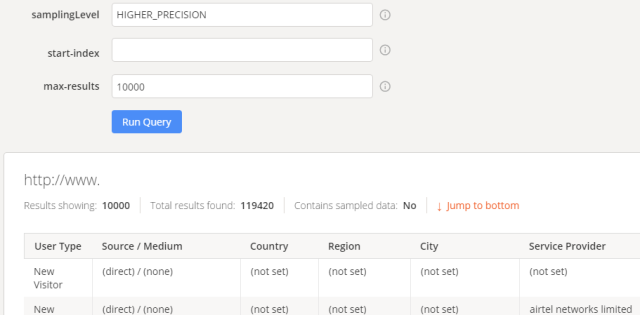
Go to the Google Analytics Query Explorer and create a query with a date range that has 10,000 or more rows. Change the max-results field to 10,000. By default only 1000 rows will be returned by the Google Analytics Query Explorer. The screen shot below shows a sample query with the first 10,000 rows of a possible 1119,797 total rows (total results found). Also right next to the results you’ll see “Contains sampled data: No” meaning there is no sampled data in the query. If there was sampled data, you would have to limit the date range to weekly or daily to get around sampling. If you scroll down to the bottom of the query explorer page you can download the results as a TSV file and open the file in Excel.
You can only pull a maximum of 10000 rows per query via the Google Analytics report API. So you will have to make multiple 10000 row queries to get more than 10000 rows of data. Change the query start-index to 10,001 20,001 30,001 etc. to get each additional 10,000 row chunk of data and then Export and combine the data in Excel.
Export 10,000 or More Rows using the Google Analytics Sheet Add-on
The Google Analytics Spreadsheet Add-on for Google Sheets is another option to export 10,000 or more rows of data from Google Analytics. The link has detailed documentation and video as well as a step by step guide to getting the Add-on setup. To make the setup process even easier for you, I’ve created a Sample Google Sheet for this tutorial. When you click on the sample sheet link it will open a view only version.
To save a copy that you can edit go to the top nav File > Make a copy… I’ll walk you through the setup process. If you have any issues leave a comment or contact me.
1) If you made a copy of the sample sheet
You should see Google Analytics under Add-ons in the top nav. Go to Add-0ns > Google Analytics > run. An overlay should pop up on the screen for you to install the the Google Analytics Add-on. Click to add it.
Then another overlay should popup asking you to give permission to the Sheets Add-on to access your Google Analytics data for the email account you are logged in on. Click to allow it.
If you are starting from a new sheet
To install the Add-on on a new Sheet go to the Add-ons menu in your Google Sheet and click on Get add-ons…Find Google Analytics and click to add it. You will have to go through the authentication process. Make sure you authenticate with the email address that has access to the Google Analytics data you want to work with.
2) If you made a copy of the sample sheet you can skip this step
If you are starting from a new sheet
In your Add-ons menu you should now see Google Analytics.
Go to Add-ons> Google Analytics> Create new report
Select the Account, Property and View (Profile) for your report. Add a name to the report. I called my report 10000 rows and for now just add Pageviews as your metric.
3) If you made a copy of the sample sheet you can skip this step
If you are starting from a new sheet
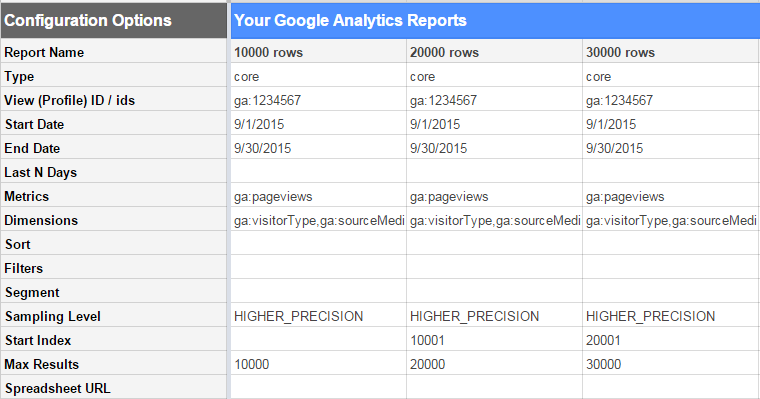
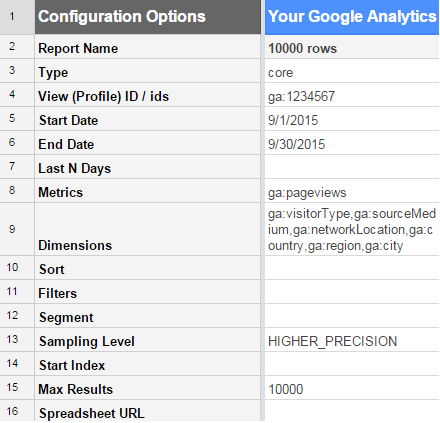
Your report will run and you should see a new tab called Report Configuration and another new tab called 10000 rows (or whatever you named your report) in your Google Sheet. Go to the Report Configuration tab and put in the date range, metrics and dimensions for your query that has 10,000 or more rows. Also, make sure to set the sampling level to “HIGHER_PRECISION” to limit sampling and set the Max Results to 10000. The screen shot below shows the configuration I used for my query. To run the query Go to Add-ons> Google Analytics> Run reports
4) Once the report runs, the data for the query will be placed in the 10000 rows tab (or whatever you named your report). The screen shot below shows the Google Analytics data in the Google Sheet for my query. You’ll see the 10,000 rows of data. Note that the query results end in row 10,015 of the Google Sheet tab due to the query header information on rows 1-15.
5) My query has 119420 total results so to capture all these results we’ll need 12 queries with 10000 rows each (the 12th query will have 9420 rows). Update the Report Configuration tab of the Google Sheet to include new columns for 20000, 30000, 40000, 50000, 60000, 70000, 80000, 90000, 100000, 111000, 120000 rows of data. I’ve simplified much of this configuration using formulas. See the Report Configuration tab in the sample sheet for all the formulas.
In the 20000 and 30000 rows columns everything in the “Type” row through the “Sampling level” row reference the cells in the 10000 rows query column. For the start index I referenced the max results row in the column to the left and added 1. The 20000 rows start index row is the max results 10000 + 1 = 10001 and the 30000 rows start index is the max results 20000 + 1= 20001 . I use the max results as a running tally of the total results which works great to keep the configuration simple and actually gets ignored when the query is run since each query can only return 10000 rows max. Don’t forget to run your query after your configuration tab is complete.
Before you run the query using the sample sheet go to the Report Configuration tab and change the sample “ga:1234567” View (Profile) ID /ids to your view id in cell B4. If you don’t change the view id you will get an error that says “User does not have sufficient permissions for this profile”. You can also change the metrics and dimensions for you query in cells B8 & B9.
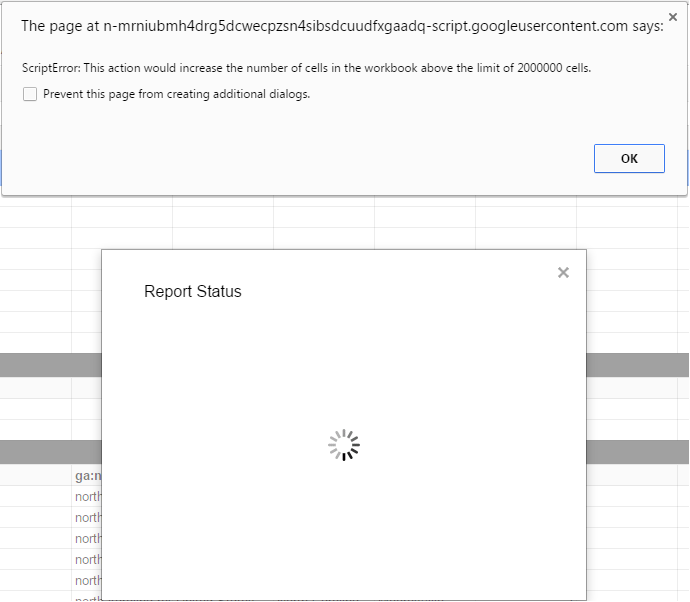
6) When your queries are run if a ScriptError alert pops up like the screenshot below telling you “This action would increase the number of cells in the workbook above the limit of 2000000 cells” have no fear and click OK. I’ve got a solution for you.
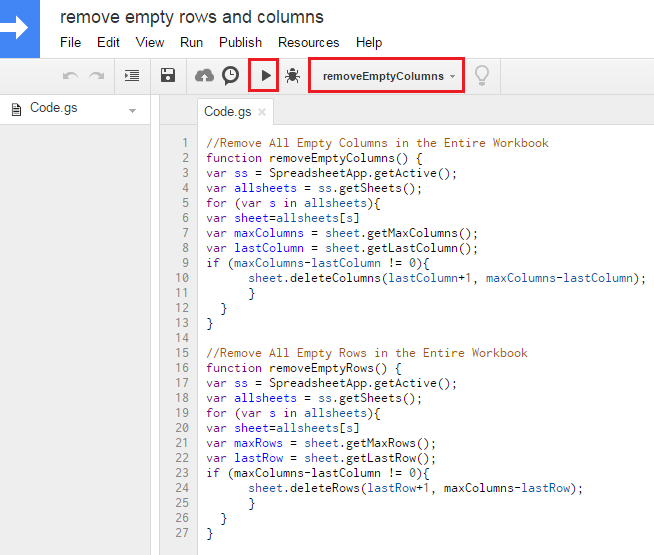
Yes it is true the maximum is 2 million cells in a Google Sheet. But what you may not know is that empty cells count against the 2 million cell limit. So it is important to delete unused cells. You can select and delete unused rows and columns in each tab of the sheet or you can use the Google App Script shown below and also embedded in the sample sheet for you.
//Remove All Empty Columns in the Entire Workbook
function removeEmptyColumns() {
var ss = SpreadsheetApp.getActive();
var allsheets = ss.getSheets();
for (var s in allsheets){
var sheet=allsheets[s]
var maxColumns = sheet.getMaxColumns();
var lastColumn = sheet.getLastColumn();
if (maxColumns-lastColumn != 0){
      sheet.deleteColumns(lastColumn+1, maxColumns-lastColumn);
      }
  }
}

//Remove All Empty Rows in the Entire Workbook
function removeEmptyRows() {
var ss = SpreadsheetApp.getActive();
var allsheets = ss.getSheets();
for (var s in allsheets){
var sheet=allsheets[s]
var maxRows = sheet.getMaxRows();
var lastRow = sheet.getLastRow();
if (maxRows-lastRow != 0){
      sheet.deleteRows(lastRow+1, maxRows-lastRow);
      }
  }
}
7) In sample sheet I’ve already taken care of running these scripts and removing the blank columns and rows for you for up to 7 dimensions and metrics and up to 12 queries or 120000 rows (total results).
If you need to run the remove columns and remove rows Google Sheet App Script go to the top nav in the sample Google Sheet click on Tools > Script Editor…
Choose the removeEmptyColumns functions in the drop down next to the bug icon show in the red box in the screen shot below then click on the play button. This function will remove all columns with empty cells from all tabs in your sheet. Repeat this for the removeEmptyRows function to remove all rows with empty cells for all tabs in your sheet.
Now that you’ve freed up extra unused cells to get below the 2 million cell limit go back and rerun your Google Analytics reports from your configuration tab. When all your data tabs have successfully loaded you should see an overlay that says Report Status “12 Reports Successfully Loaded” for the 12 queries in the sample sheet.
Make sure to rerun the removeEmptyColumns Google App Script to free up any empty cells from the new data tabs.
Check out this video overview of the removeEmptyColumns and removeEmptyRows Google Sheet Script.
Consolidated Unsampled Google Analytics Report with 120k Rows
Now that we have all of our data let’s return to our original goal. We want more than 10000 rows of unsampled Google Analytics data. We can check off the unsampled requirement when we know our date range and dimensions and metrics combination for our query returned no sampled data. See row 6 “Contains Sampled Data” for any of the tabs with the query data. For the sample query this says no we are all set. If this said yes we would have to limit the date range to a smaller period like a week or day until the “Contains Sampled Data” says No.
But we are not done yet. We still need to combine the multiple tabs of 10000 rows into a single master data tab that we’ll call the “all data” tab. We will create the new all data tab and fit it to our full data set. Let’s delete columns H through Z since we only need 7 columns for our dimensions and metric and let’s add rows to the bottom of the sheet maxium 40000 rows at a time until we have enough to fit our nearly 120000 rows of results. To pull all the data together from the multiple tabs we’ll use the array formula shown below and included on the all data tab in cell A1 in the sample sheet.
={'10000 rows'!A15:G10015;'20000 rows'!A16:G10015;'30000 rows'!A16:G10015;'40000 rows'!A16:G10015;'50000 rows'!A16:G10015;'60000 rows'!A16:G10015;'70000 rows'!A16:G10015;'80000 rows'!A16:G10015;'90000 rows'!A16:G10015;'100000 rows'!A16:G10015;'110000 rows'!A16:G10015;'120000 rows'!A16:G10015}
If you are having performance issues with the sample sheet delete the all data tab while you are running your queries. Then when you are ready to consolidate your data add the all data tab back in and add the array formula to cell A1. When your consolidated data loads if Google Sheets still crashes copy and paste the values in the all data tab to a new blank Google Sheet.
You are now ready to analyze your unsampled 120k row Google Analytics data set! If you have any questions please let me know in the comments or on Twitter @ryanpraski.
